그래프를 그리다 보면 그래프 영역을 표시해야할 때가 있다. 그럴땐 패턴을 사용한다.
\documentclass[]{article}
\usepackage{tikz}
\usetikzlibrary{patterns}

\begin{document}
\pagenumbering{gobble}
\begin{figure}

 \begin{tikzpicture}[scale=1]

 \draw [thick,->] (-4,0) --  (4,0) node [anchor=north] {$x$};
 \draw [thick,->] (0,-1)  -- (0,6) node [anchor=east] {$y$};
 \node [below] at (-0.3,0) {$0$};

 \draw[pattern=north east lines,  dashed](-3,0)-- (-3,3.6) -- plot  [domain=-3:3, smooth,variable=\x] ({\x},{0.4*(\x)^2}) -- (3,0)  -- cycle;

 \draw[dashed] (-3,0) -- (-3,-0.2) node[below]{$-a$};
 \draw[dashed] (3,0) -- (3,-0.2) node[below]{$a$};

 \draw[domain=-3.5:3.5, smooth,thick,,variable=\x, blue] plot ({\x},{0.4*(\x)^2}) node[left]{$y=f(x)$};

 \end{tikzpicture}

\end{figure}

\end{document}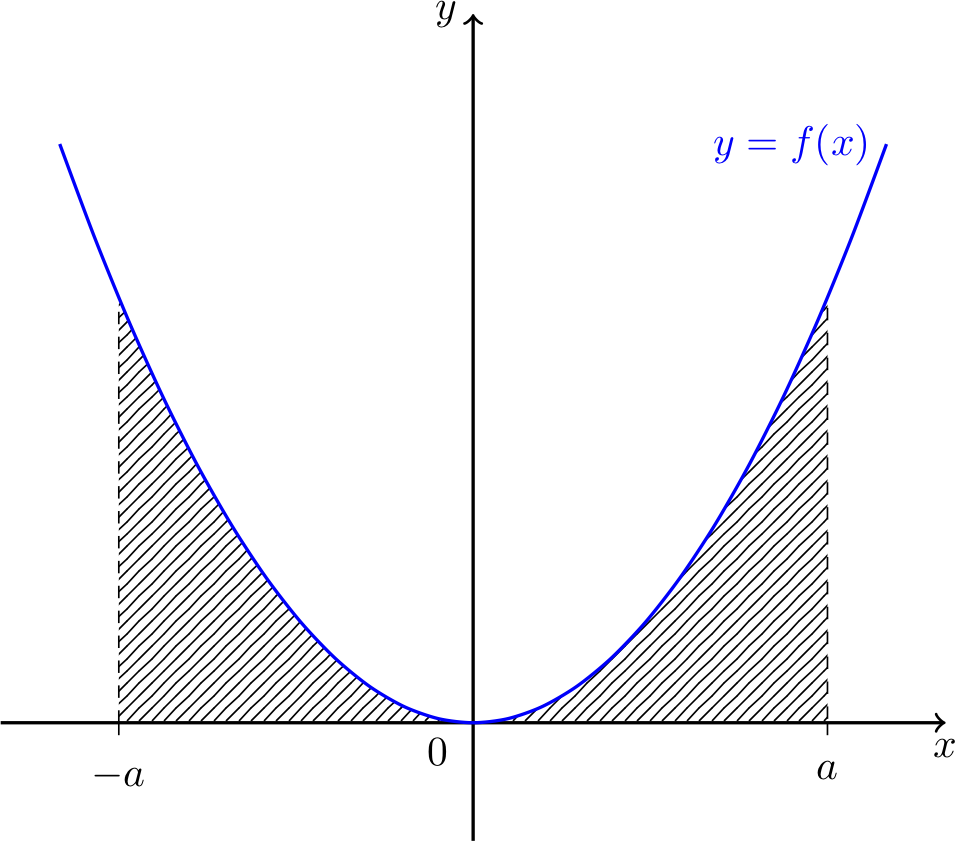
\documentclass[]{article}
\usepackage{tikz}
\usetikzlibrary{patterns}

\begin{document}
\pagenumbering{gobble}
\begin{figure}

 \begin{tikzpicture}[scale=1]

 \draw [thick,->] (-4,0) --  (4,0) node [anchor=north] {$x$};
 \draw [thick,->] (0,-4)  -- (0,4) node [anchor=east] {$y$};
 \node [below] at (-0.3,0) {$0$};

 \draw[pattern=north east lines,  dashed](-3,0)-- (-3,-3) -- plot  [domain=-3:0, smooth,variable=\x] ({\x},{\x})  -- cycle;

 \draw[pattern=north east lines,  dashed](0,0)-- (3,0) -- (3,3) -- cycle;

 \draw[dashed] (-3,0) -- (-3,0.2) node[above]{$-a$};
 \draw[dashed] (3,0) -- (3,-0.2) node[below]{$a$};

 \draw[domain=-3.5:3.5, smooth,thick,,variable=\x, blue] plot ({\x},{\x}) node[left]{$y=g(x)$};

 \end{tikzpicture}

\end{figure}

\end{document}
\documentclass[]{article}
\usepackage{tikz}
\usetikzlibrary{patterns} %그래프 아래 영역을 표시학 위해서 필요합니다.
\usepackage[hangul]{kotex} %한글을 쓰려면 kotex
\begin{document}
 \pagenumbering{gobble}
 \begin{figure}

  \begin{tikzpicture}[scale=1]

  \draw [thick,->] (-1,0) --  (8,0) node [anchor=north] {$x$};
  \draw [thick,->] (0,-1)  -- (0,6) node [anchor=east] {$y$};

  \draw[pattern=north east lines,  dashed](0.5,0)-- (0.5,5.2375) -- plot  [domain=0.5:3.5, smooth,variable=\x] ({\x},{0.1*(\x+1)*(\x-2)*(\x-6)+4}) -- (3.5,0)  -- cycle;

  \draw[dashed] (5.5,0) --(5.5,2.8625);

  \draw[dashed] (0.5,0) -- (0.5,-0.2) node[below]{$a$};
  \draw[dashed] (3.5,0) -- (3.5,-0.2) node[below]{$t$};
  \draw[dashed] (5.5,0) -- (5.5,-0.2) node[below]{$b$};

  \draw[domain=-0.5:6.5, smooth,thick,,variable=\x, blue] plot ({\x},{0.1*(\x+1)*(\x-2)*(\x-6)+4}) node[left]{$y=f(x)$};

  \node [below] at (-0.3,0) {$0$};
  \node [above] at (2,1) {\large$\textrm{넓이 : }S(t)$};

  \end{tikzpicture}

 \end{figure}
\end{document}
댓글 없음:
댓글 쓰기